
Notice
Recent Posts
Recent Comments
Link
| 일 | 월 | 화 | 수 | 목 | 금 | 토 |
|---|---|---|---|---|---|---|
| 1 | 2 | 3 | 4 | 5 | 6 | 7 |
| 8 | 9 | 10 | 11 | 12 | 13 | 14 |
| 15 | 16 | 17 | 18 | 19 | 20 | 21 |
| 22 | 23 | 24 | 25 | 26 | 27 | 28 |
| 29 | 30 |
Tags
- useForm
- 다음은 메인페이지
- project
- 구조분해할당
- Tanstack Query
- useEffect
- 문제
- wecode
- mini
- 이중map
- 구조화된 데이터
- JS
- React
- css
- 처음부터 배포까지
- teamproject
- TIL
- miniproject
- Threppa
- next.js
- 팀프로젝트
- 다중map
- ToyProject
- wescanner
- html
- javascript
- echarts
- react-hook-form
- toy project
- 일본 우편번호 api
Archives
- Today
- Total
블로그 이름을 입력해주세요
Javascript Apache ECharts 본문
JS를 사용하는 프론트 개발자들이 한번 쯤 들어봤을 유명한 차트 라이브러리인 echarts를 회사 요구사항에 맞춰 사용해 보았다 그 중 line chart를 만들어 보았다 다양한 차트의 종류는 공식 doc를 통해 확인 할 수 있다
https://echarts.apache.org/examples/en/index.html
Examples - Apache ECharts
echarts.apache.org
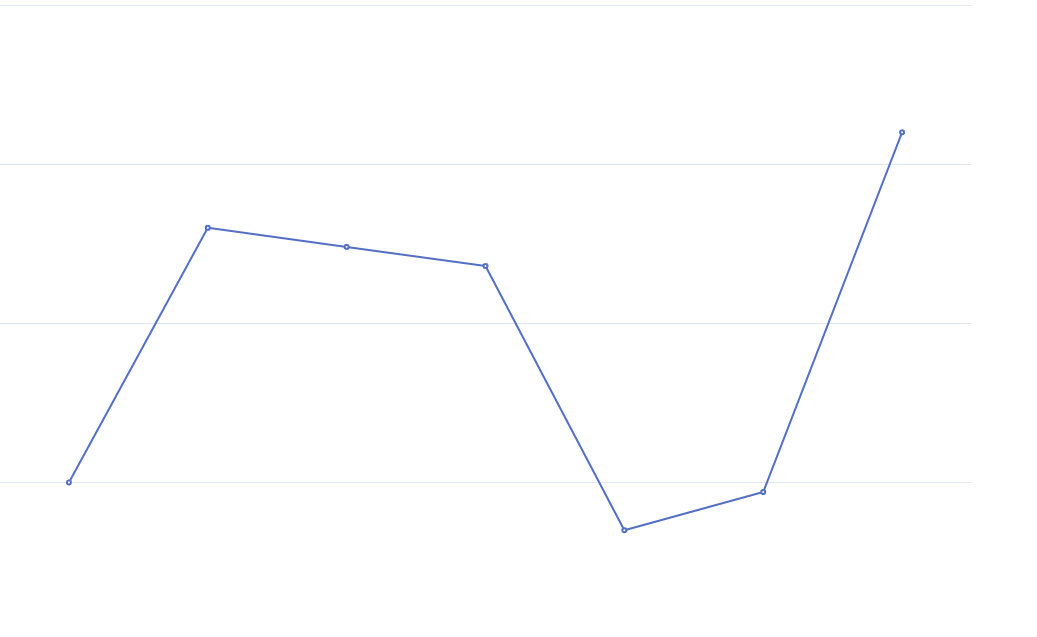
Javascript
<!DOCTYPE html>
<html>
<head>
    <title>Line Chart Example</title>
    <!-- ECharts CDN -->
    <script src="https://cdn.jsdelivr.net/npm/echarts@5.2.2/dist/echarts.min.js"></script>
</head>
<body>
    <!-- 차트를 표시할 div 요소 -->
    <div id="chart" style="width: 600px; height: 400px;"></div>

    <script>
        // ECharts 초기화 및 차트 설정
        var chartDom = document.getElementById('chart');
        var myChart = echarts.init(chartDom);
        var option;

        // 차트 데이터 설정 (예: x축과 y축 데이터)
        var xAxisData = ['2021-01', '2021-02', '2021-03', '2021-04', '2021-05', '2021-06'];
        var seriesData = [150, 230, 224, 218, 135, 147];

        // 옵션 설정
        option = {
            xAxis: {
                type: 'category',
                data: xAxisData
            },
            yAxis: {
                type: 'value'
            },
            series: [{
                data: seriesData,
                type: 'line'
            }]
        };

        // 옵션을 설정하고 차트 렌더링
        if (option && typeof option === 'object') {
            myChart.setOption(option);
        }
    </script>
</body>
</html>
React
install
npm install echarts echarts-for-react
LineChart.js
// LineChart.js
import React from 'react';
import ReactECharts from 'echarts-for-react';

const LineChart = () => {
  const option = {
    title: {
      text: '월별 매출'
    },
    tooltip: {
      trigger: 'axis'
    },
    xAxis: {
      type: 'category',
      data: ['2021-01', '2021-02', '2021-03', '2021-04', '2021-05', '2021-06']
    },
    yAxis: {
      type: 'value'
    },
    series: [
      {
        name: '매출',
        data: [150, 230, 224, 218, 135, 147],
        type: 'line',
        smooth: true
      }
    ]
  };

  return (
    <div style={{ width: '100%', height: '400px' }}>
      <ReactECharts option={option} style={{ height: '100%' }} />
    </div>
  );
};

export default LineChart;
App.js
// App.js
import React from 'react';
import LineChart from './LineChart';

function App() {
  return (
    <div className="App">
      <h2>라인 차트 예제</h2>
      <LineChart />
    </div>
  );
}

export default App;
이를 통해 만든어본 Rainbow chart
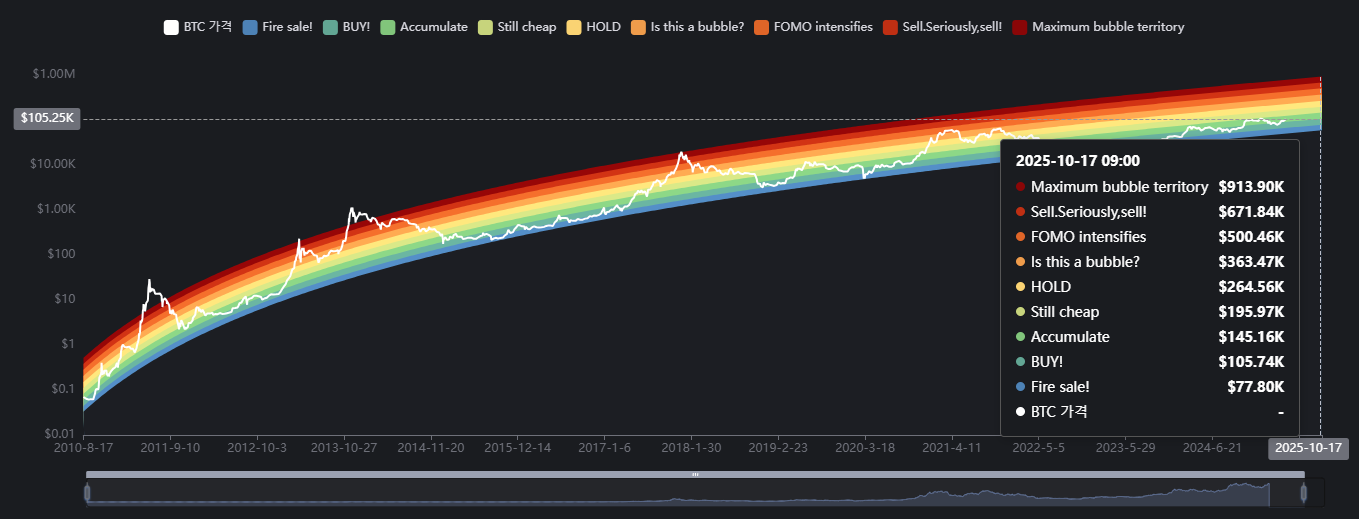
직접 사용해 보니 다양한 옵션을 제공 하는것도 장점 이지만 차트 라이브러리의 단점인 커스텀의 자유도가 어느정도 보장되어 있는거 같아 앞으로 유용하게 사용할 수 있을거 같다
'웹 개발' 카테고리의 다른 글
| Aceternity UI (1) | 2025.06.14 |
|---|---|
| 웹사이트에 구조화된 데이터 활용하기 (0) | 2025.05.07 |
| 시맨틱 마크업 : 구글에서 내 사이트가 잘 보이지 않는 이유 (0) | 2025.04.22 |
| [Next.js] Tanstack Query Mutations (0) | 2025.04.09 |
| [Next.js] Tanstack Query로 SSR ??? (0) | 2025.03.23 |
'웹 개발' Related Articles
more


